
How to Track Amazon KDP Book Performance: Complete Analytics Guide (2025)
Master KDP analytics with comprehensive tracking strategies, performance metrics, and optimization techniques for book sales success.

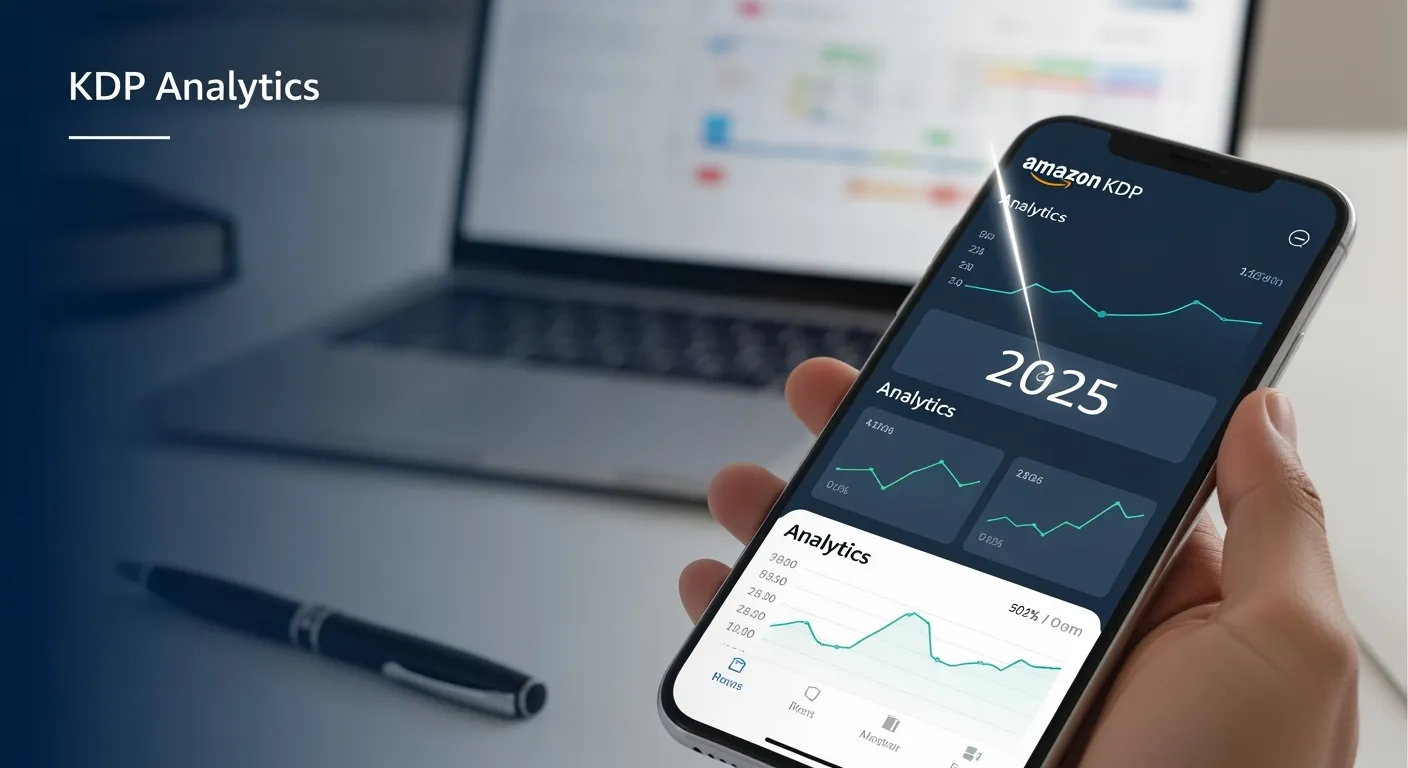
Tracking your KDP book performance shouldn’t require a PhD in data analysis. Most authors struggle with scattered reports, manual spreadsheets, and missed opportunities. Here’s how to get actionable insights that actually improve your book sales and ROI.
What KDP Analytics Actually Tell You
Before diving into tracking methods, understand what analytics should deliver:
- Sales performance: Revenue, units sold, royalty trends across markets
- Marketing ROI: Which ads, keywords, and campaigns drive profitable sales
- Reader behavior: Review patterns, conversion rates, and engagement signals
- Market position: How your books rank against competitors over time
- Opportunity identification: Trends, gaps, and optimization possibilities
Most authors track vanity metrics. Smart authors track metrics that drive decisions.
The Current Analytics Landscape: Why Authors Struggle
The Scattered Data Problem
Your book performance data lives in multiple places:
- KDP Reports: Sales data, but delayed and hard to analyze
- Amazon Ads Console: Campaign metrics, but disconnected from organic sales
- Review tracking: Manual monitoring across different marketplaces
- Spreadsheets: Manual data entry with human error and version control issues
The Manual Analytics Trap
Most authors try to solve this with Excel:
- Download KDP sales reports weekly
- Manually input ad spend and ACOS data
- Try to correlate marketing activities with sales spikes
- Build charts that are outdated by the time they’re finished
- Miss real-time opportunities while wrestling with formulas
Result: Hours spent on data wrangling, minimal time for strategic decisions.
Method 1: Manual Analytics Management (Traditional Approach)
This is how most authors currently track their book performance. It works but requires significant time investment and expertise.
Step 1: KDP Sales Report Analysis
Download and organize reports:
- Export sales data from KDP dashboard (available 24-48 hours delayed)
- Separate by marketplace (US, UK, CA, AU, etc.)
- Track: units sold, royalties earned, pages read (KU), return rates
- Note seasonal patterns and promotional impact
Time investment: 2-3 hours weekly for multiple books
Step 2: Amazon Ads Performance Tracking
Campaign analysis workflow:
- Export campaign reports from Amazon Ads console
- Calculate true ACOS including organic sales lift
- Track keyword performance and negative keyword opportunities
- Monitor bid adjustments and budget utilization
- Correlate ad performance with organic rank improvements
Common challenges:
- Attribution gaps between ad clicks and organic sales
- Delayed reporting makes real-time optimization difficult
- Complex data relationships require advanced Excel skills
Step 3: Review and Ranking Monitoring
Manual monitoring process:
- Check BSR (Best Seller Rank) daily across categories
- Monitor review count, average rating, and recent review sentiment
- Track competitor movements and new releases
- Note changes in also-bought and also-viewed recommendations
Tools needed:
- Browser bookmarks for frequent rank checking
- Review monitoring tools (Helium 10, Jungle Scout)
- Spreadsheet templates for tracking trends
Step 4: ROI and Profitability Analysis
Financial tracking requirements:
- Calculate net profit per book (royalties - marketing costs - production costs)
- Track lifetime value and payback periods for different marketing channels
- Monitor cash flow impact of promotional activities
- Analyze profit margins across different price points and markets
Complexity factors:
- Multiple currency conversions and exchange rate fluctuations
- Tax implications and quarterly reporting requirements
- Attribution modeling for multi-touch customer journeys
Step 5: Reporting and Decision Making
Monthly analysis process:
- Consolidate all data sources into comprehensive reports
- Identify trends, opportunities, and performance gaps
- Make strategic decisions about budget allocation and optimization
- Plan next month’s marketing activities based on performance data
Timeline: 6-10 hours monthly for thorough analysis Success rate: ~30% of authors maintain consistent tracking Main challenges: Time investment, data complexity, human error
When Manual Analytics Work
Choose manual tracking when:
- You have 1-2 books and limited marketing activity
- You enjoy data analysis and have strong Excel skills
- Budget constraints prevent tool investments
- You want to understand every detail of the tracking process
Method 2: Automated Analytics Systems
Smart authors use integrated platforms that handle the complete analytics pipeline automatically, providing real-time insights without manual data wrangling.
The Chrome Extension Integration Advantage
Modern analytics platforms use browser extensions to capture real-time KDP data:
KDPGenius Assistant Chrome Extension features:
- Automatic session monitoring when logged into KDP
- Real-time sales data capture without manual downloads
- Seamless integration with Amazon Ads performance
- Multi-marketplace data synchronization
- Automatic currency conversion and tax calculation
How Automated Analytics Actually Work
Data Collection Layer:
- Chrome extension captures KDP session data automatically
- Direct integration with Amazon Ads API for real-time metrics
- Review monitoring across all major marketplaces
- Competitive intelligence gathering and rank tracking
Processing and Analysis:
- Automatic data cleaning and validation
- Advanced attribution modeling for true marketing ROI
- Predictive analytics for trend identification
- Anomaly detection for opportunity flagging
Dashboard and Insights:
- Real-time performance dashboards with customizable views
- Automated alerts for significant changes or opportunities
- Drill-down capabilities from high-level metrics to granular data
- Export functionality for external reporting needs
Real-Time Analytics Dashboard Features
Performance Overview:
- Today’s sales, last 7 days, last 30 days with percentage changes
- Revenue trends across different markets and currencies
- Order volume and average selling price analysis
- KU page reads and estimated earnings
Marketing ROI Analysis:
- True ACOS calculation including organic lift attribution
- Campaign performance with automated optimization suggestions
- Keyword performance tracking with expansion opportunities
- Budget utilization and pacing alerts
Competitive Intelligence:
- Your books’ rank positions vs. key competitors
- Market share analysis within your niches
- New competitor alerts and threat assessment
- Pricing optimization recommendations based on market dynamics
Reader Behavior Insights:
- Review velocity and sentiment trending
- Conversion rate optimization opportunities
- Customer lifetime value analysis
- Cross-selling and upselling potential identification
Advanced Analytics: Beyond Basic Tracking
Multi-Book Portfolio Management
Portfolio overview dashboard:
- Performance comparison across your entire book catalog
- Resource allocation optimization across titles
- Cross-promotion opportunity identification
- Series performance and reader journey analysis
Strategic planning tools:
- Revenue forecasting based on historical performance
- Market expansion opportunity analysis
- Content gap identification within your portfolio
- Seasonal planning and promotional calendar optimization
Marketplace Intelligence
Global performance tracking:
- Performance comparison across US, UK, CA, AU, and other markets
- Currency impact analysis and hedging strategies
- Localization opportunity identification
- International expansion planning and execution
Competitive landscape monitoring:
- Market share tracking within specific niches
- Competitor launch detection and impact assessment
- Pricing strategy optimization based on competitive dynamics
- Content strategy insights from competitor performance analysis
Predictive Analytics and Forecasting
Sales prediction modeling:
- Revenue forecasting based on current trends and seasonality
- Marketing budget optimization using predictive ROI models
- Launch planning with expected performance ranges
- Risk assessment for new market or category expansion
Opportunity identification:
- Underperforming asset identification and optimization recommendations
- Market timing signals for promotional activities
- Content development priorities based on market demand analysis
- Cross-selling and upselling automation opportunities
Cost-Benefit Analysis: Manual vs. Automated Analytics
Manual Analytics Costs
Time investment breakdown:
- Weekly data collection and processing: 3 hours
- Monthly analysis and reporting: 4 hours
- Quarterly strategic planning: 8 hours
- Annual time cost: 200+ hours
Hidden costs:
- Opportunity cost of missed real-time optimizations
- Human error in data entry and analysis
- Delayed decision-making due to reporting lag
- Stress and complexity management overhead
Total cost calculation:
- Time value: 200 hours × $50/hour = $10,000
- Tool subscriptions: $500-1,000 annually
- Missed opportunities: $2,000-5,000 estimated
- Total annual cost: $12,500-16,000
Automated Analytics Investment
Platform costs:
- KDPGenius premium: €39.99/month = $528 annually
- Chrome extension: Included
- Data processing and storage: Included
- Support and updates: Included
Time savings:
- Data collection: Automated (saves 150+ hours)
- Analysis and insights: 30 minutes weekly (saves 100+ hours)
- Strategic planning: Enhanced with predictive insights (saves 50+ hours)
- Total time savings: 300+ hours annually
ROI calculation:
- Time savings value: 300 hours × $50/hour = $15,000
- Platform cost: $528
- Net benefit: $14,472 annually
- ROI: 2,744%
Implementation Guide: Setting Up Automated Analytics
Phase 1: Chrome Extension Installation and Setup
Installation process:
- Download KDPGenius Assistant from Chrome Web Store
- Log into your KDP account while extension is active
- Complete OAuth authentication for secure data access
- Verify data capture across all your books and markets
Configuration steps:
- Set up automatic sync preferences (daily, weekly, real-time)
- Configure currency display and conversion preferences
- Enable notification alerts for significant changes
- Set up data retention and privacy preferences
Phase 2: Dashboard Customization and Integration
Dashboard setup:
- Choose key metrics for homepage display
- Configure date ranges and comparison periods
- Set up custom alerts and notification thresholds
- Create views for different analysis needs (daily ops, strategic planning)
Integration configuration:
- Connect Amazon Ads accounts for complete ROI analysis
- Set up competitor tracking lists
- Configure review monitoring across marketplaces
- Enable predictive analytics and forecasting features
Phase 3: Team Access and Workflow Integration
User management:
- Set up team member access levels if applicable
- Configure report sharing and export preferences
- Establish workflow integration with existing tools
- Create standard operating procedures for data-driven decisions
Optimization workflow:
- Daily: Review overnight performance and anomalies
- Weekly: Analyze trends and adjust marketing tactics
- Monthly: Strategic planning based on comprehensive insights
- Quarterly: Portfolio optimization and expansion planning
Common Analytics Mistakes and How to Avoid Them
Mistake 1: Vanity Metrics Focus
The problem: Tracking page views, impressions, and other metrics that don’t drive profitability.
The solution: Focus on revenue, net profit, customer acquisition cost, and lifetime value.
Automated advantage: Professional systems highlight profit-driving metrics while filtering noise.
Mistake 2: Attribution Confusion
The problem: Crediting organic sales to paid ads or missing the impact of promotional activities.
The solution: Use advanced attribution modeling that accounts for multi-touch customer journeys.
Manual challenge: Nearly impossible to track accurately without sophisticated tools.
Mistake 3: Delayed Decision Making
The problem: Waiting for monthly reports before making optimization decisions.
The solution: Real-time monitoring with automated alerts for significant changes.
Competitive advantage: React to opportunities and threats within hours instead of weeks.
Mistake 4: Single-Market Tunnel Vision
The problem: Only tracking US performance while missing opportunities in other English-speaking markets.
The solution: Multi-marketplace monitoring with unified reporting and currency conversion.
Global insight: Understand how your books perform across different cultural and economic contexts.
Mistake 5: Competitor Blindness
The problem: Focusing only on your own performance without market context.
The solution: Competitive intelligence that shows your relative market position and opportunities.
Strategic benefit: Identify market gaps and positioning opportunities before competitors do.
Advanced Features: What Professional Analytics Platforms Provide
Automated Reporting and Alerts
Smart notification system:
- Significant rank changes (positive or negative)
- Review velocity changes and sentiment shifts
- Competitor launches in your categories
- Budget pacing alerts and optimization opportunities
- Seasonal trend detection and preparation reminders
Custom report generation:
- Automated monthly performance summaries
- ROI analysis with actionable recommendations
- Competitive landscape updates
- Portfolio performance comparisons
- Tax reporting and financial summaries
Predictive Analytics and Machine Learning
Sales forecasting:
- Revenue predictions based on current trends and seasonality
- Launch performance modeling for new book planning
- Marketing budget optimization using historical ROI data
- Market expansion opportunity identification
Optimization recommendations:
- Automated bid adjustment suggestions for Amazon Ads
- Pricing optimization based on competitive dynamics and demand elasticity
- Content development priorities based on market gap analysis
- Cross-promotion opportunities within your book portfolio
Integration Ecosystem
Third-party tool connectivity:
- Direct integration with Amazon Ads for unified ROI analysis
- Connection to design tools for performance-based creative optimization
- Integration with email marketing platforms for reader engagement
- API access for custom reporting and business intelligence tools
Data export and analysis:
- Raw data export for advanced analysis in Excel or BI tools
- API access for integration with existing business systems
- Custom reporting templates for specific business needs
- Data backup and retention for historical analysis
Choosing the Right Analytics Approach
Manual Analytics: When It Makes Sense
Ideal candidates:
- Authors with 1-2 books and minimal marketing activity
- Strong Excel skills and enjoyment of data analysis
- Tight budget constraints requiring free solutions
- Desire to understand every aspect of the tracking process
Success requirements:
- Consistent weekly time commitment (3-5 hours)
- Advanced spreadsheet skills for complex analysis
- Understanding of attribution modeling and marketing metrics
- Discipline to maintain tracking systems over time
Automated Analytics: When It’s Worth the Investment
Ideal candidates:
- Authors with multiple books or aggressive publishing schedules
- Focus on writing and strategy over data management
- Value time savings over cost savings
- Need real-time insights for competitive advantage
ROI indicators:
- Publishing 3+ books annually
- Monthly marketing spend of $500+
- Time value of $25+ per hour
- Growth-focused business strategy
Getting Started: Implementation Roadmap
Week 1: Assessment and Planning
Current state analysis:
- Document your current analytics process and time investment
- Identify key metrics that drive your publishing decisions
- Calculate the true cost of your current approach
- Define success criteria for analytics improvement
Goal setting:
- Establish specific metrics for tracking improvement
- Set target time savings and insight quality goals
- Define budget parameters for analytics investment
- Create timeline for implementation and evaluation
Week 2: Tool Selection and Setup
For manual approach enhancement:
- Download improved Excel templates
- Set up automated data connections where possible
- Create standardized reporting schedules
- Implement basic competitor tracking
For automated platform adoption:
- Sign up for platform trial (KDPGenius offers free trial)
- Install Chrome extension and complete setup
- Connect all relevant accounts and data sources
- Configure initial dashboard and alert preferences
Week 3: Data Validation and Calibration
Accuracy verification:
- Compare new system results with historical manual data
- Verify currency conversions and tax calculations
- Test alert systems and notification preferences
- Calibrate reporting periods and comparison benchmarks
Workflow integration:
- Establish daily, weekly, and monthly review routines
- Create decision-making frameworks based on specific metrics
- Set up team access and communication protocols
- Document standard operating procedures
Week 4: Optimization and Scaling
Performance tuning:
- Adjust dashboard configurations based on usage patterns
- Refine alert thresholds to minimize noise while catching opportunities
- Optimize reporting frequency and format for decision-making speed
- Identify additional metrics or features needed for complete analysis
Strategic application:
- Make first data-driven optimization decisions
- Plan next month’s activities based on insights gained
- Identify opportunities for expanded tracking or analysis
- Evaluate ROI and plan for continued system improvement
The Future of KDP Analytics
Emerging Trends and Technologies
AI-powered insights:
- Automated pattern recognition for opportunity identification
- Predictive modeling for market trend anticipation
- Natural language query interfaces for complex analysis
- Automated optimization recommendations with confidence scoring
Enhanced attribution modeling:
- Cross-platform customer journey tracking
- Long-term customer lifetime value prediction
- Multi-touch attribution for complex marketing funnels
- Real-time ROI optimization based on attribution insights
Competitive intelligence advancement:
- Real-time competitor monitoring and alert systems
- Market share analysis and positioning optimization
- Pricing strategy optimization based on competitive dynamics
- Content gap analysis and opportunity identification
Preparing for Advanced Analytics
Data foundation building:
- Establish consistent tracking practices now
- Build historical data sets for future analysis
- Develop team skills for interpreting advanced insights
- Create decision-making frameworks that scale with available data
Strategic positioning:
- Focus on metrics that drive long-term competitive advantage
- Build analytics capabilities as a core business competency
- Prepare for increased competition and market sophistication
- Develop data-driven decision-making culture
The Next Strategic Step
With your analytics system implemented to monitor performance, the final step is to master advanced writing systems that will allow you to produce professional-quality content at scale, completing the entire strategic Amazon KDP workflow.
Next: Advanced Writing System: The Dante Method for KDP Authors
Try KDPgenius free and research your book's keywords in under 10 minutes.
Try KDPgenius Free